Asian markets update at 7 am
The GIFT NIFTY is trading flat, suggesting a muted opening for the NIFTY50. Meanwhile, in Asia, markets are mixed with Japan’s Nikkei 225 up 0.5% and Hong Kong’s Hang Seng index is down 1.3%.
U.S. market update
- Dow Jones: 40,211 (▲0.5%)
- S&P 500: 5,631 (▲0.2%)
- Nasdaq Composite: 18,472 (▲0.4%)
U.S. stocks continued to rally on the back of strong Q2 results from major banks. Goldman Sachs profit rose 150% YoY, while BlackRock’s profits beat estimates and its AUM hit a record $10.6 trillion. However, markets were jittery following an assassination attempt on former U.S. President Donald Trump. This led to increased bets on his potential victory in November, which could lead to tax cuts, increase in trade tariffs and reduced regulation.
NIFTY50
- July Futures: 24,621 (▲0.4%)
- Open Interest: 5,70,901 (▲2.6%)
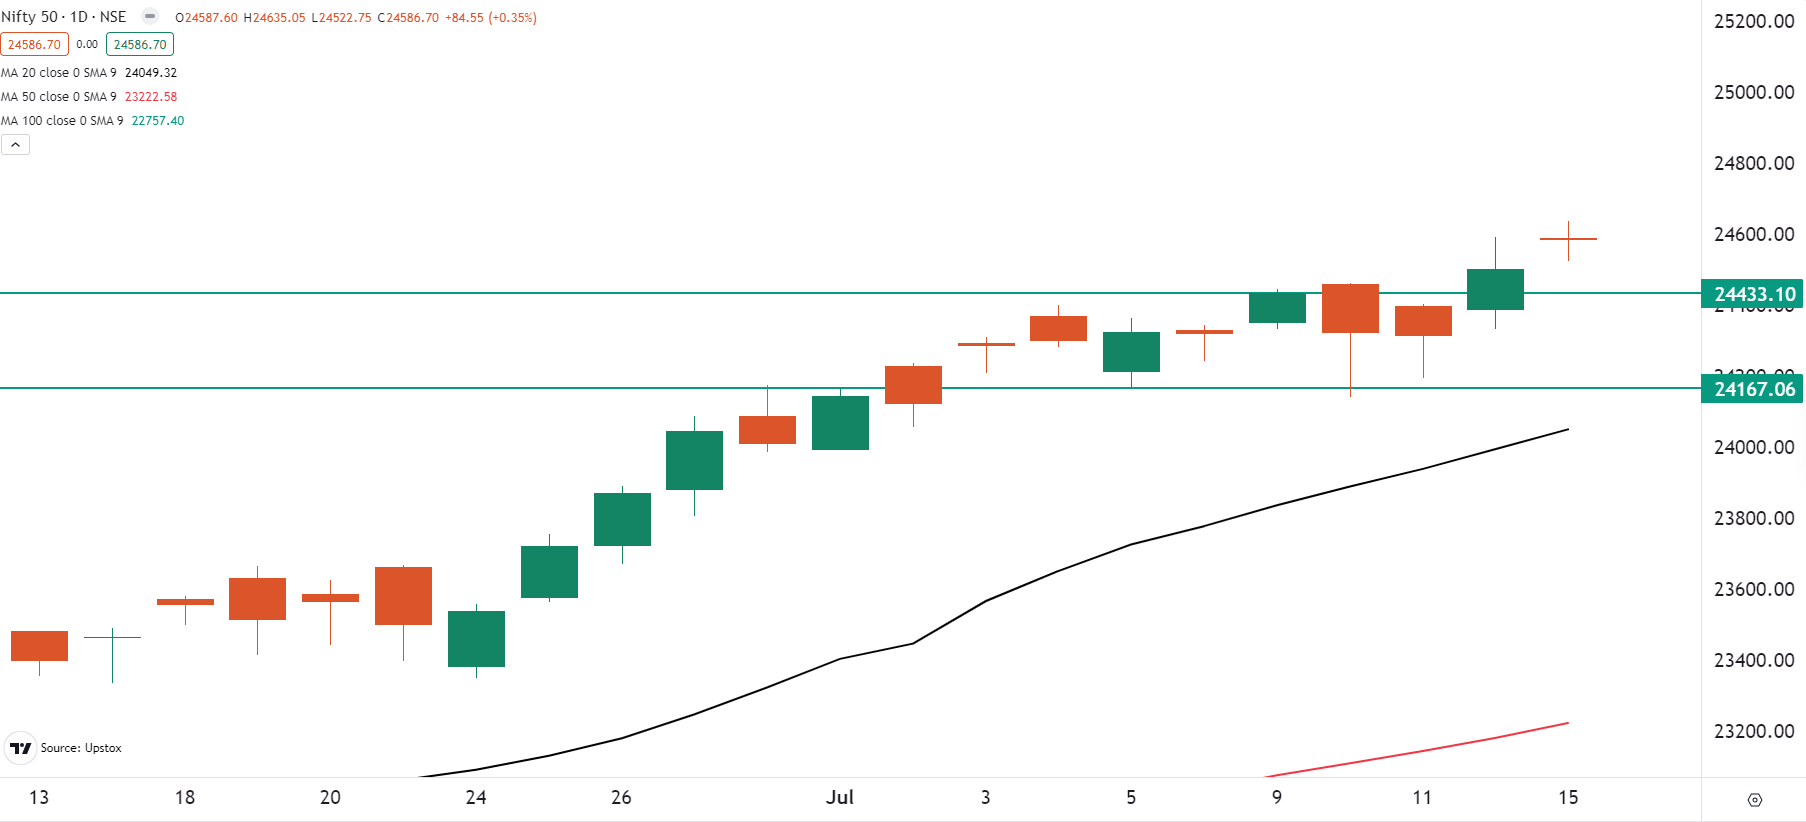
After a positive start, the NIFTY50 index gradually moved higher to close at record highs, led by broad-based buying across sectors. The index formed a doji candlestick on the daily chart, reflecting investors’ indecision.
The formation of a doji after the recent uptrend signals a pause at current levels ahead of next week’s Union Budget. While the overall trend of the index remains positive, a close below the doji would signal weakness and profit-booking. On the other hand, a close above the doji would signal a resumption of the current trend.
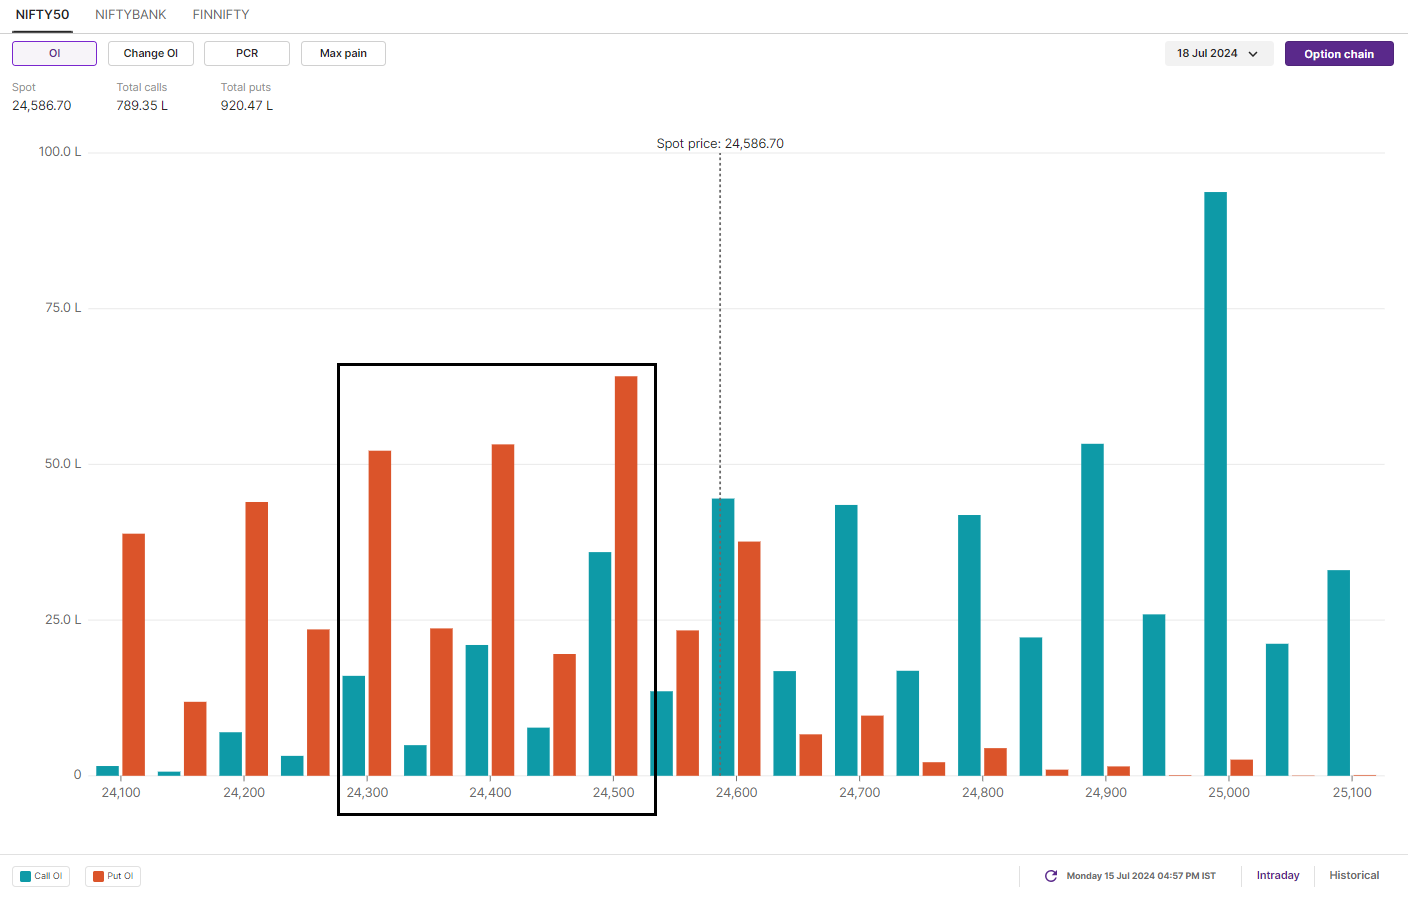
The open interest (OI) for the July 18 expiry has the maximum call OI at the 25,000 strike, indicating resistance for the index. On the other hand, the maximum put OI is placed between the 24,500 and 24,300 strikes, suggesting support for the index in this area.
BANK NIFTY
- July Futures: 52,630 (▲0.5%)
- Open Interest: 1,39,057 (▲4.4%)
The BANK NIFTY witnessed volatility throughout the day and continued its range-bound trading for the seventh consecutive session. A strong rally in PSU banks, led by State Bank of India, lifted the index. Meanwhile, fluctuations in HDFC Bank and ICICI Bank added to the day’s volatility.
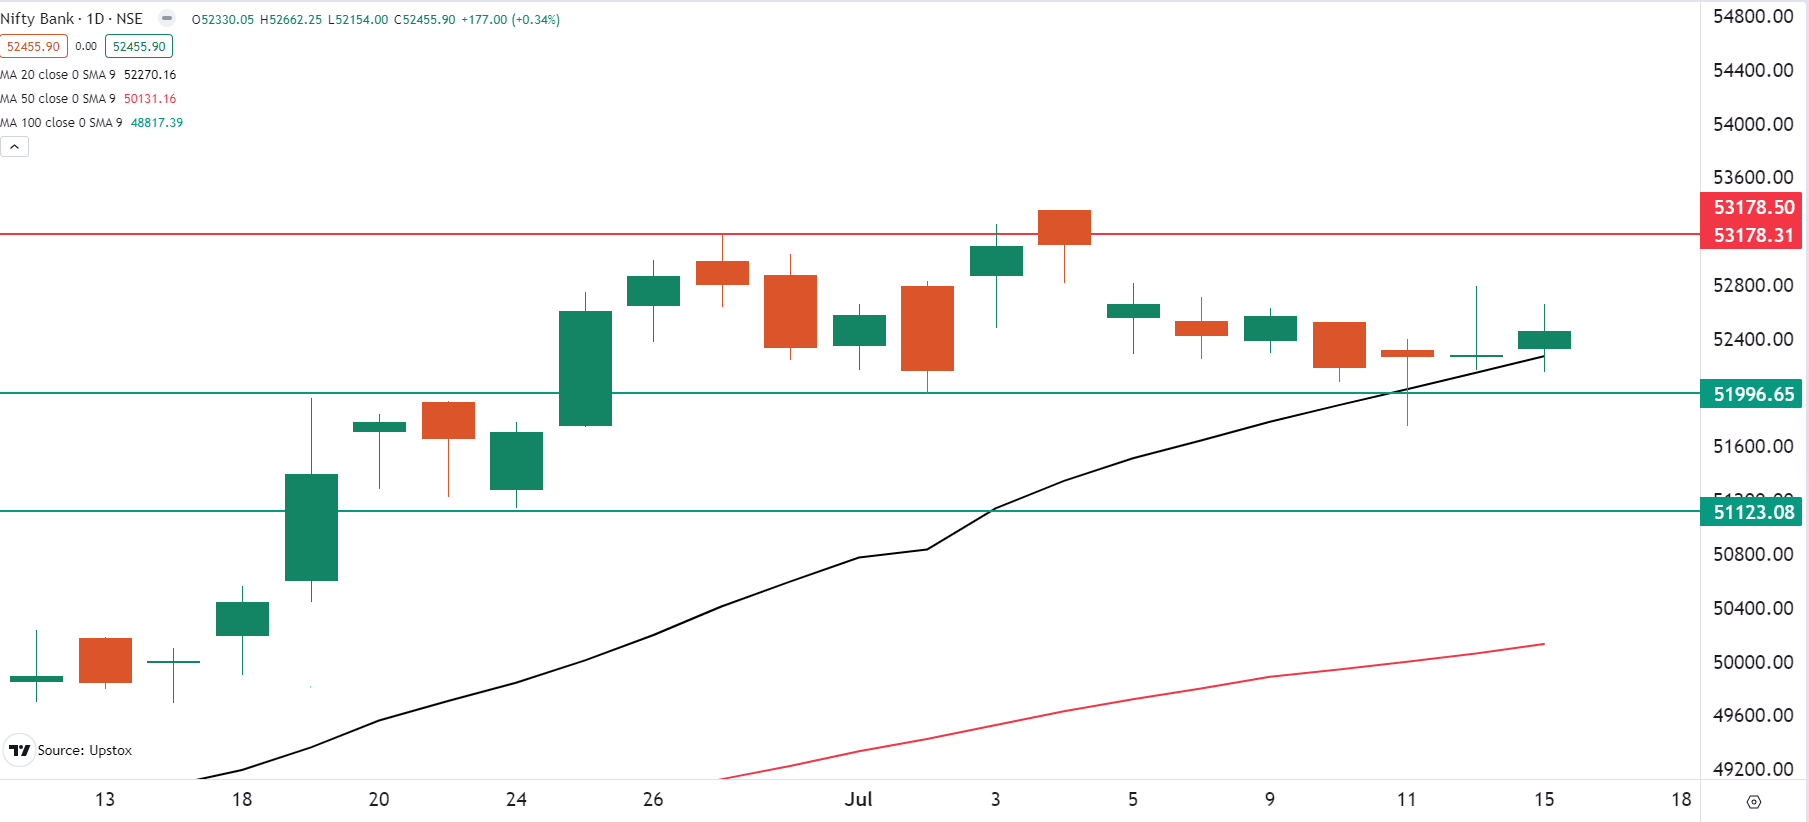
On the daily chart, the index maintained its position above the 20-day moving average for the third consecutive day and closed higher than the previous two sessions. As mentioned in yesterday’s analysis, the index continues to range between 52,800 and 52,000. Until it breaks out of this range, traders can expect sideways movement.
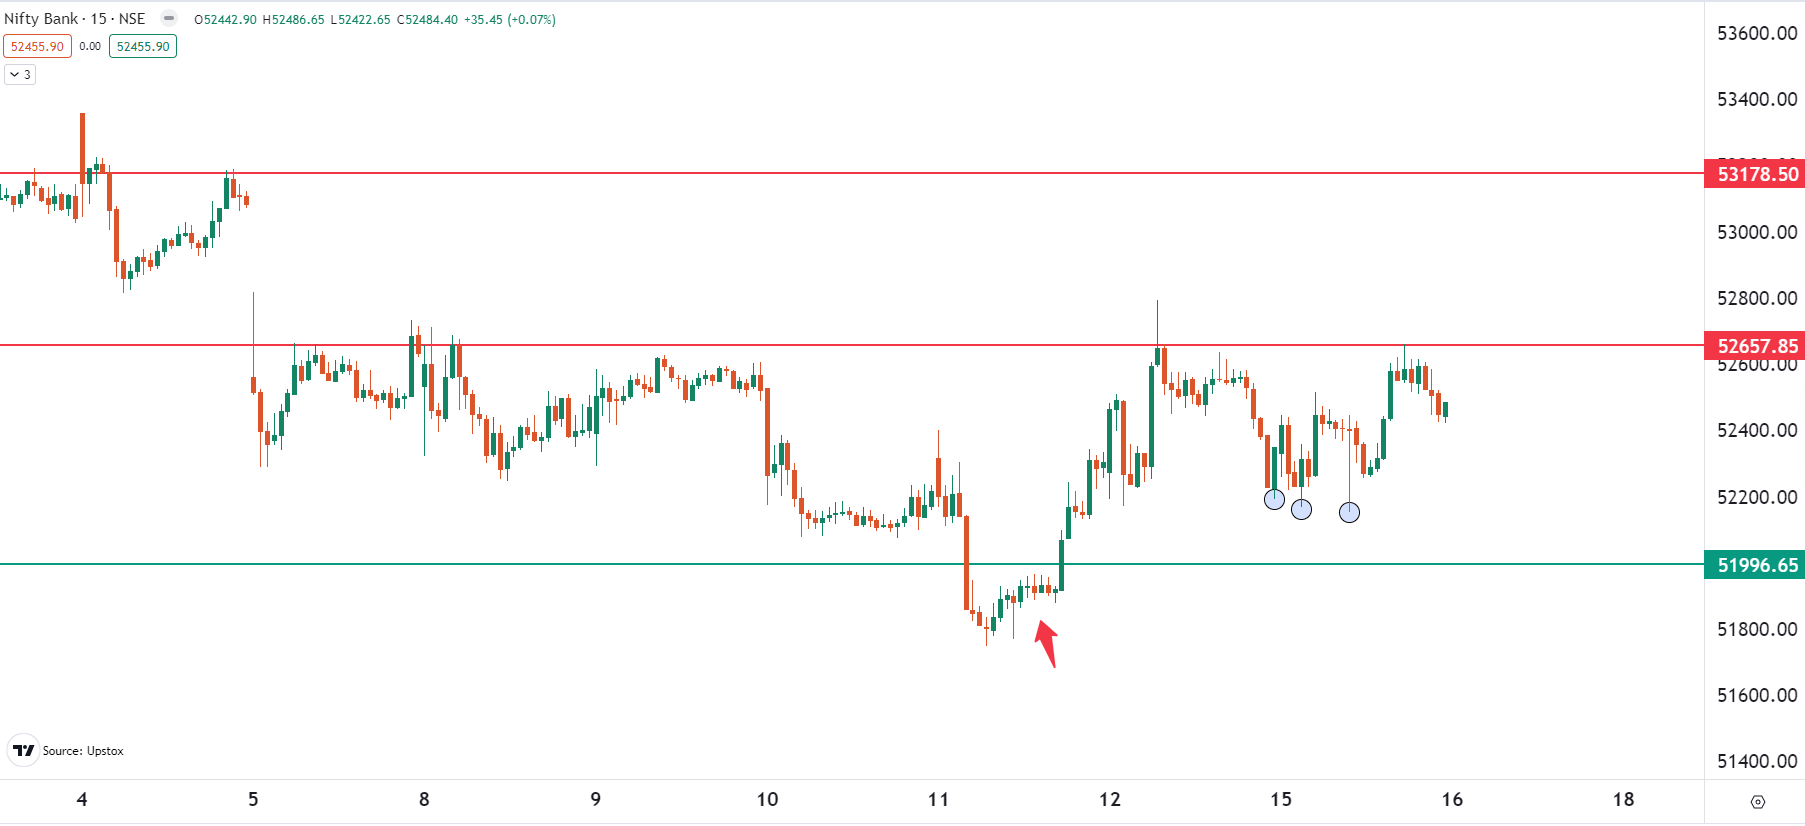
As shown in the chart below, except for the false breakdown on 11 July at the critical 52,000 mark, the index has been trading between 52,650 and 52,000. A breakout from this range on an intraday basis will provide traders with further directional clues.
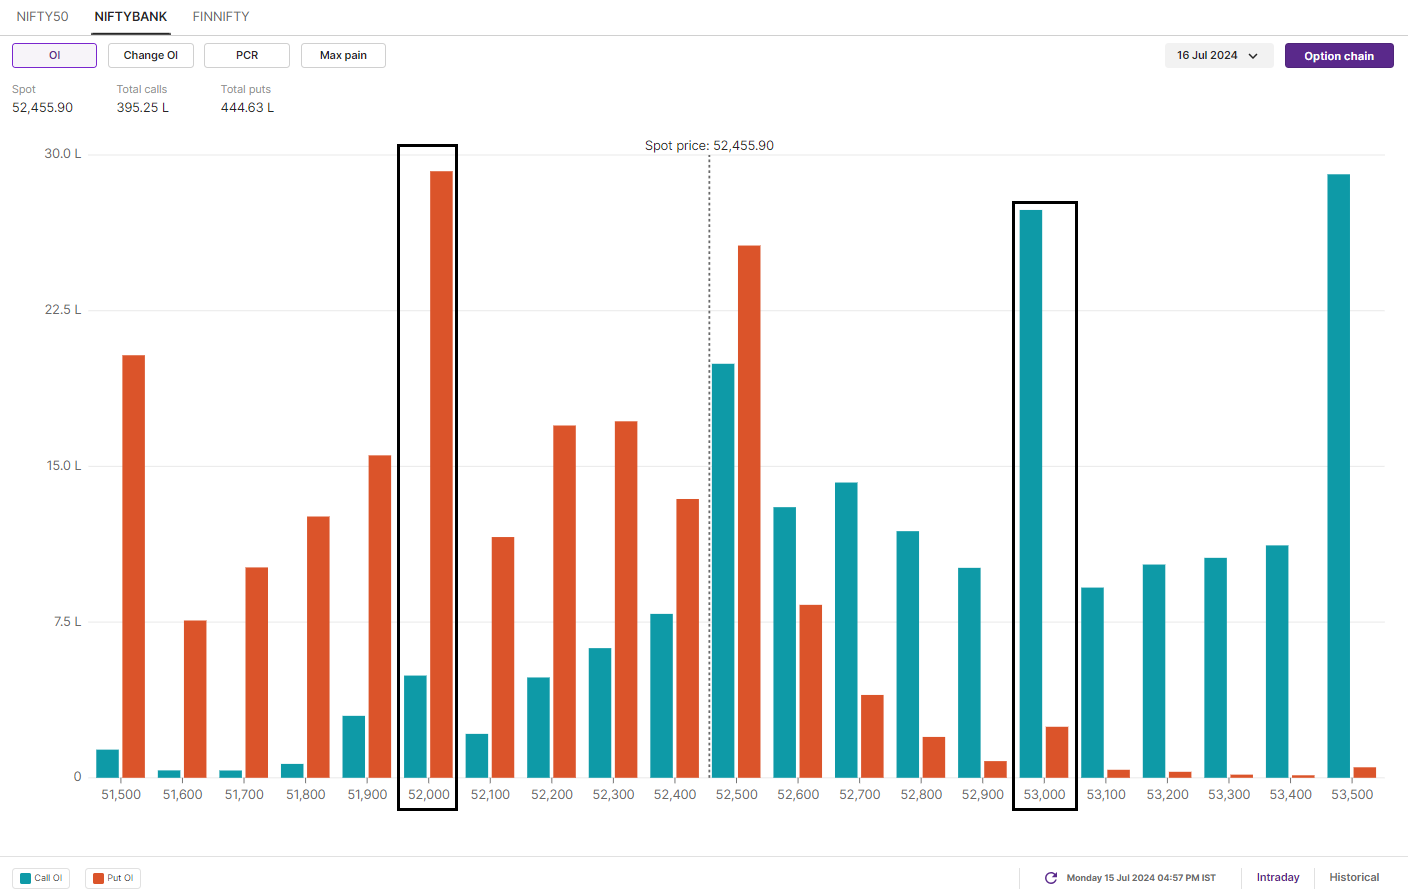
Open interest (OI) build-up for today’s expiry shows significant put writing at the 52,500 and 52,000 strikes, indicating support at these levels. The maximum call base is at the 53,000 and 53,500 strikes, establishing these as resistance zones for the index.
FII-DII activity
Stock scanner
Under F&O Ban: Aditya Birla Fashion and Retail, Chambal Fertilisers, GMR Infra, Gujarat Narmada Valley Fertilisers & Chemicals, Hindustan Copper, India Cements, Indus Towers and RBL Bank
Out of F&O Ban: Balrampur Chini Mills, Bandhan Bank, Indian Energy Exchange and Piramal Enterprises
In Futures and Options or F&O, long build-up means an increase in Open Interest (OI) along with an increase in price, and short build-up means an increase in Open Interest(OI) along with a decrease in price.
Source: Upstox and NSE.
Disclaimer:
Derivatives trading must be done only by traders who fully understand the risks associated with them and strictly apply risk mechanisms like stop-losses. The information is only for consumption by the client and such material should not be redistributed. We do not recommend any particular stock, securities and strategies for trading. The securities quoted are exemplary and are not recommendatory. The stock names mentioned in this article are purely for showing how to do analysis. Take your own decision before investing.


)
)


