Gold Price Analysis, Price, and Chart
- US 1-month US bill yields test multi-decade highs.
- FOMC minutes and Core PCE yields the next macro drivers for the precious metal.
Recommended by Nick Cawley
Get Your Free Gold Forecast
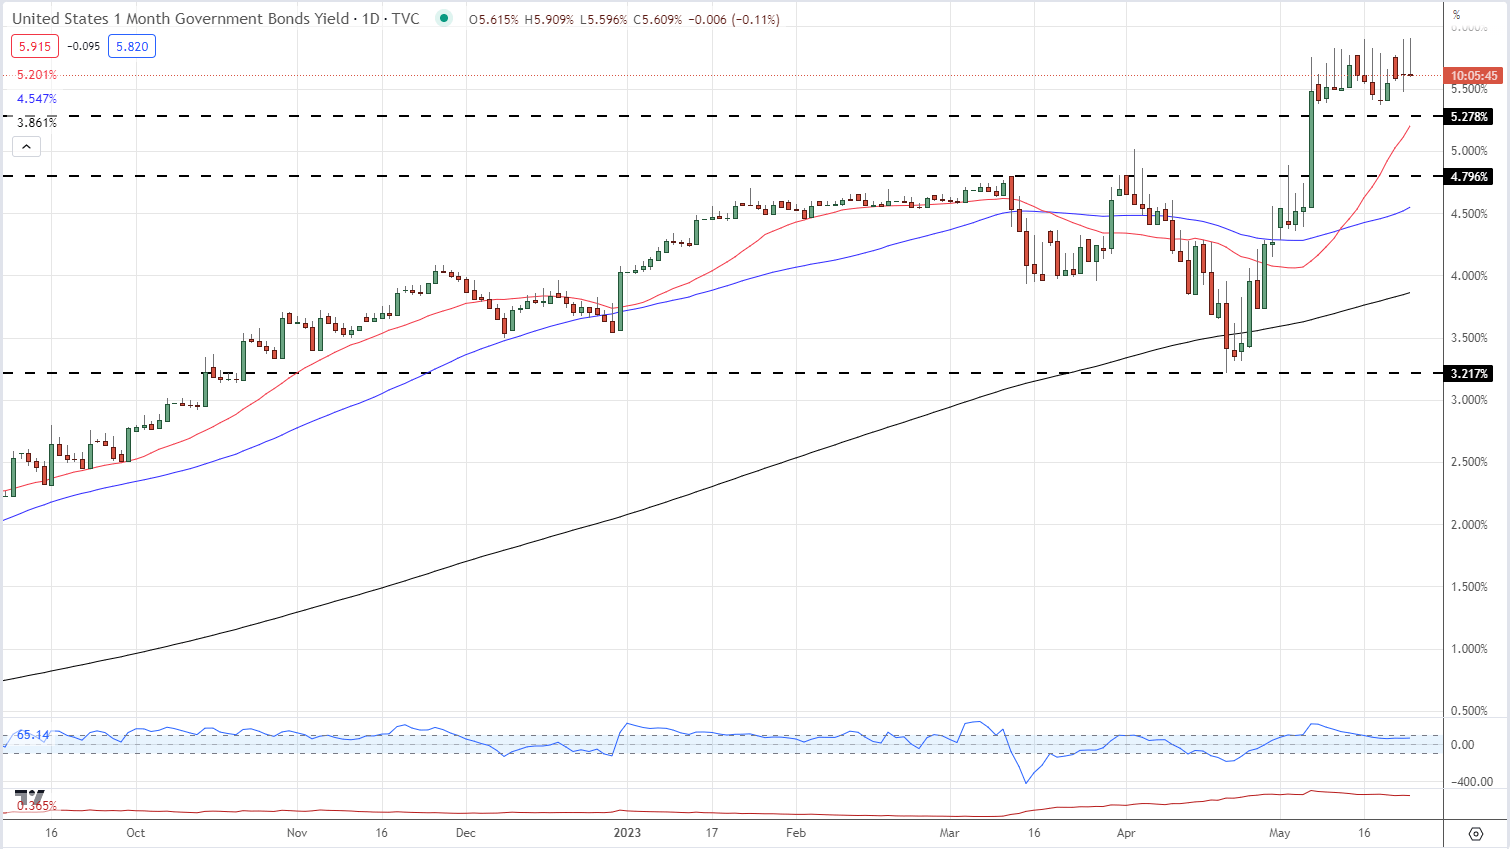
Fears that the ongoing debt discussions may be too little too late and see the US go into a technical default continue to drive up short-term US Treasury bill yields to levels not seen in decades. The 1-month US T Bill now trades with a yield of around 5.65% as investors demand more for their money over the negotiation period. The talks between President Joe Biden and Speaker of the House Kevin McCarthy have so far produced little of note despite both sides saying that ongoing conversations are productive, while President Biden added that a default was ‘off the table’. Treasury Secretary Janet Yellen’s recent comments that if an agreement was not reached by early June then a debt default was ‘highly likely’ continue to rattle the market.
US 1-Month Treasury Bill Yield - Daily Price Chart
While gold is currently battling elevated US bond yields, ahead this week, starting later today, there are a few high-importance US economic data releases and events for gold traders to consider. This evening the latest FOMC Minutes should give the market more detail about what was discussed at the last meeting, while Thursday sees the release of the second US Q2 GDP reading. On Friday, the Fed’s preferred measure of inflation, Core PCE is released at 12:20 GMT ahead of the final Michigan Consumer Sentiment report for May.
For all market-moving data releases and events, see the DailyFX Economic Calendar
Gold remains near a recent multi-week low at $1,952/oz. and may re-test this level if US bond yields rally further. The sell-off from the May 4 multi-decade high at $2,081/oz. has been unrelenting with little in the way of any sustained rebound seen. If gold is to push higher then resistance from the 20- and 50-day moving averages, at $1,993/0z. and $2,001/oz. will need to be taken out convincingly.
Gold Price Daily Chart - May 15, 2023
Chart via TradingView
Daily -7% 6% -3% Weekly -1% -10% -4%What does it mean for price action?
Get My Guide
Retail Traders Remain Long
Retail trader data show 65.63% of traders are net-long with the ratio of traders long to short at 1.91 to 1.The number of traders net-long is 1.65% lower than yesterday and 0.33% lower from last week, while the number of traders net-short is 3.87% higher than yesterday and 6.57% lower from last week.
We typically take a contrarian view to crowd sentiment, and the fact traders are net-long suggests Gold prices may continue to fall. Positioning is less net-long than yesterday but more net-long from last week. The combination of current sentiment and recent changes gives us a further mixed Gold trading bias.
What is your view on Gold - bullish or bearish?? You can let us know via the form at the end of this piece or you can contact the author via Twitter @nickcawley1.
DailyFX provides forex news and technical analysis on the trends that influence the global currency markets.
Source link