

Cell types and their proportion in the SN of PD patients
Based on the cell annotation results on the Single Cell Portal uploaded by Prof. Macosko’s group, cells were extracted and classified into different types from human SN samples (Fig. 1A). After 135,344 cells were extracted from 34 PD samples and 184,673 cells were extracted from 45 control samples. We obtained a total of seven major groups of cells, which were dopaminergic neurons, non-dopaminergic neurons, astrocytes, oligodendrocytes, OPCs, endothelial cells/pericytes and microglia/macrophages. By statistical analysis of the proportion of cells in each sample, we found that only dopaminergic neurons were significantly decreased in the SN pars compacta in PD patients, and that other six groups of cells were not changed obviously (Fig. 1B).
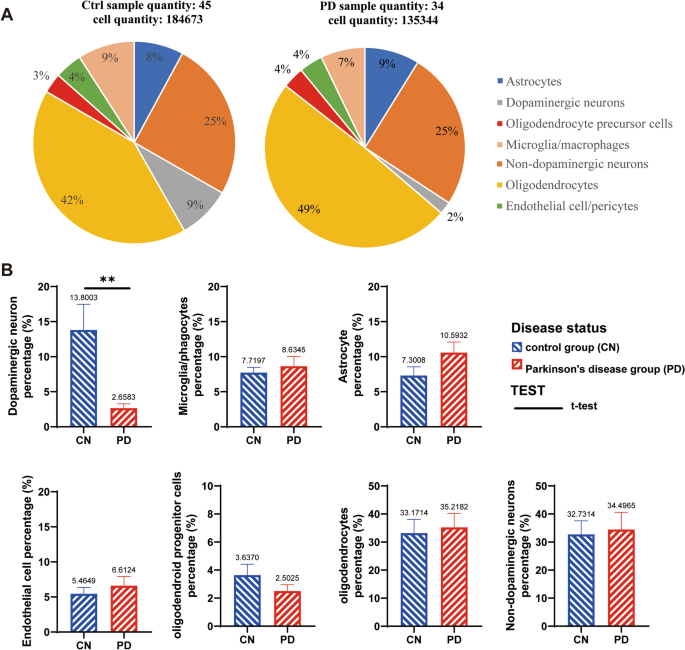
Cell types and proportions in the SN of PD patients and the control group (CN). A shows the combining multiple samples together for statistical analysis. A total of 184,673 cells from 45 CN people were screened in the control group, and the whole number of each cell types was calculated to the total cell population (184,673 cells). While 135,344 cells from 34 PD patients were screened in the PD group, in which the proportion of each cell types was calculated to the whole population (135,344 cells). B is the statistical analysis of the proportion of cells in each individual sample with T-TEST, there are 45 CN samples and 34 PD patients used for statistical analysis, but the samples with data of 0% were excluded in charts. **p < 0.01.
Identification of DEGs between the PD and control groups
The results of differential gene analysis of each cell type in the SN of PD patients and controls are shown in Fig. 2. The five DEGs with the greatest up- and down-regulation changes are marked in each type of cell. The five most upregulated genes in dopaminergic neurons were TRPM3, TTTY14, FLRT2, FOXP2 and SEZ6L, while the five most downregulated genes were GAPDH, EYA4, SEMA5A, TIAM2 and ALDH1A1 (Fig. 2A). The five most up-regulated genes in non- dopaminergic neurons were TTTY14, MAP1A, NEFH, MT-ND4 and MT-ND3, while the five most down-regulated genes were TSHZ2, GALNTL6, ASIC2, PMCH and HDC (Fig. 2B). The five most upregulated genes in astrocytes were HMGB1, HSPH1, PTGES3, SLC7A11 and HSPA4L, while the five most downregulated genes were ANGPTL4, ETNPPL, SLC4A4, SLC6A11 and LINC00499 (Fig. 2C). The five most upregulated genes in oligodendrocytes were HSPH1, HSPA1A, HSPB1, PTGES3 and HSP90AA1, while the five most downregulated genes were NAALADL2, MIR219-2, PPP2R2B, PDE1A and POLR2F (Fig. 2D). The five most upregulated genes in OPCs were HSPH1, CHORDC1, HSPA4L, PTGES3 and HSPA1A, while the five most downregulated genes were ROBO2, RYR2, TENM2, SYT1 and GALNTL6 (Fig. 2E). The five most upregulated genes in endothelial cell/pericytes were HSPA1A, HSPB1, DNAJB1, HSPH1 and HSP90AA1, while the five most downregulated genes were ATP1A2, TXNIP, SLC6A1-AS1, TAGLN and HBB (Fig. 2F). The five most upregulated genes in microglia/macrophages were HSPH1, HSPB1, HSP90AA1, CHORDC1 and PTGES3, while the five most downregulated genes were CD14, SLC2A3, CCDC26, HAMP and TMEM163 (Fig. 2G).
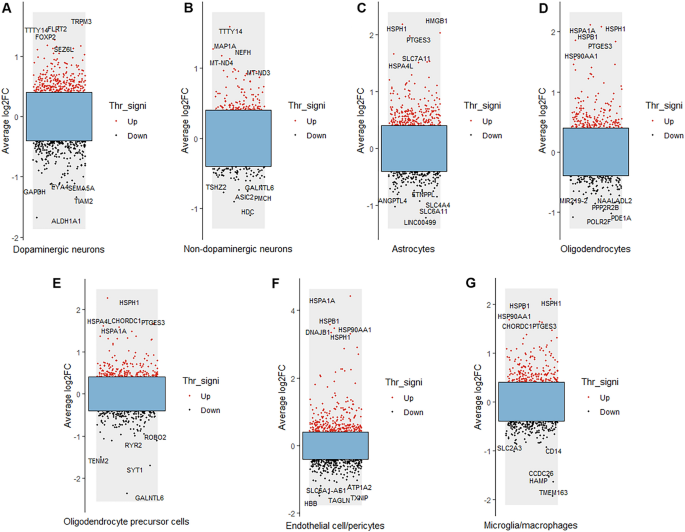
Results of DEG analysis of each cell type in PD. Red dots represent up-regulated genes; black dots represent down-regulated genes. Average log2FC indicates average log2-fold change, and Thr_signi represents the threshold value and significance. The five most up-regulated genes and the five most down-regulated genes in each cell type are provided.
Screening of ferroptosis-related DEGs in the seven cell types
We downloaded ferroptosis related gene from FerrDb v2. Among the Fr-genes, genes that have been verified in humans were selected, and duplicate genes were removed, based on gene symbol. Among these, 5 genes (AQP3, AQP5, AQP8, DAZAP1, NT5DC2) were not annotated in the verified tissues, but were confirmed to be related to ferroptosis in humans by consulting the literature19. Finally, 401 Fr-genes were obtained through screening.
The Fr-DEGs of each type of cell were identified using the intersection method. There were 479 DEGs in dopaminergic neurons, with 11 Fr-DEGs identified (Fig. 3A). There were 192 DEGs in non-dopaminergic neurons, with 5 Fr-DEGs identified (Fig. 3B). The difference in numbers of DEGs between dopaminergic neurons and non-dopaminergic neurons is indicative of the specific damage to dopaminergic neurons in PD. Astrocytes showed 381 DEGs, with 22 Fr-DEGs identified (Fig. 3C). There were 301 DEGs in oligodendrocytes, with 15 Fr-DEGs identified (Fig. 3D). There were 354 DEGs in OPCs, with 9 Fr-DEGs identified (Fig. 3E). There were 516 DEGs in endothelial cell/pericytes, with 25 Fr-DEGs identified (Fig. 3F). There were 361 DEGs in microglia/macrophages, with 15 Fr-DEGs identified (Fig. 3G). All the genes with altered expression are shown in Table 1. Although FTH expression decreased in dopaminergic neurons, the change was not shown due to a p_val_adj > 0.05.
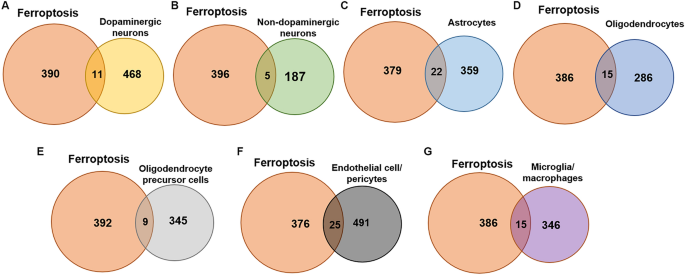
Fr-DEGs in various cell types.
Enrichment analysis of DEGs in dopaminergic neurons and construction of a PPI network
The loss of dopaminergic neurons in the SN is a hallmark feature of the pathophysiology of PD. Therefore, we conducted enrichment analysis and PPI network construction of the DEGs of dopaminergic neurons. The enrichment analysis of the dopaminergic neuron DEGs mainly revealed changes in ATP metabolism process, cell response to stress, motor behavior, dopaminergic synapses, dopamine neurotransmitter release cycle and long-term potential difference in the dopaminergic neurons of PD patients (Fig. 4). The Cytoscape classic plug-in MCODE (molecular complex detection) of Metascape can be used to discover closely connected molecular complex regions in a PPI network. We performed functional enrichment analysis on the identified sub-networks to further clarify the role of these potential complexes in life regulation. The PPI network shows genes that have cooperative relationships with other genes, in the context of MCODE components (Fig. 5). Overall, the MCODE data not only show the relationships of the differential gene expression in Parkinson’s and various NDs, but also specifically demonstrate enrichment of the oxidative phosphorylation pathway.
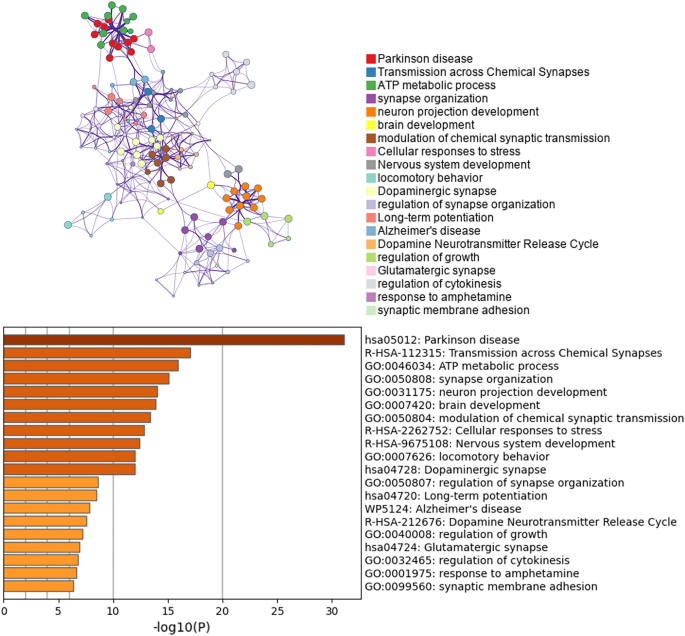
Hierarchical clustering results and clustering trees for functional enrichment of dopaminergic neuron DEGs. Only the p-value information is shown in the histogram, which can be viewed against the dendrogram.
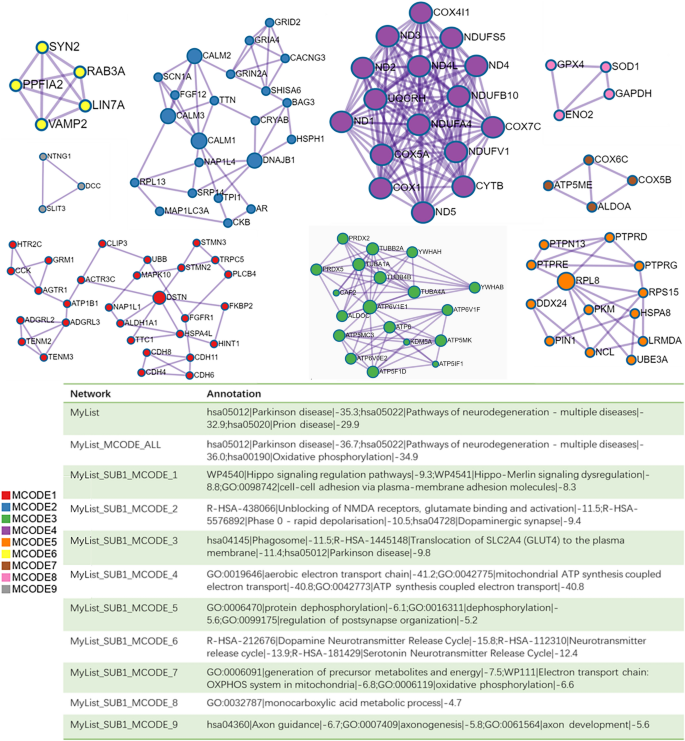
PPI network and MCODE component analysis results. Genes that do not interact with other genes in the list of DEGS are not provided. The PPI network shows genes that have cooperative relationships with other genes, and also possess MCODE components. MCODE reveals closely connected molecular complex regions in the PPI network.
Identification of secreted proteins from Fr-DEGs in all cells
Interactions between cells is a key feature in the cellular activities of multicellular life20. We hypothesized that a secreted protein between cells contributes to the loss of neurons in PD by affecting the sensitivity of dopaminergic neurons to ferroptosis. To test this, we annotated the gene functions of Fr-DEGs in all cell types, and then screened for genes encoding secreted proteins. Three DEGs encoding secreted proteins (HMGB1 [high-mobility group box 1 protein], CP [ceruloplasmin], TF [transferrin]) were found in PD patients. Among these genes, the expression of CP increased in astrocytes, the expression of HMGB1 increased in all types of cells, and the expression of TF decreased in oligodendrocytes (Table 2).
Screening for Fr-DEGs encoding secreted proteins in microarray data
Using the bulk RNA-seq data in the GEO database, we verified the altered expression of the three genes, HMGB1, CP, and TF, in the SN of PD patients. Gene changes at the SN level are congruent with the hypothesis that dopaminergic neurons are affected by these proteins. The increase in CP expression was verified in the GSE49036 and GSE20164 datasets (Table 3). However, there were no significant verified changes in HGB1 or TF, which may be due to technical differences between the screening methods. This implicated that changes at the single-cell level don’t necessarily reflect changes at the overall tissue level.


